

Bitcoin’s price movements may seem unpredictable at times, but beneath the volatility, certain metrics can provide valuable insights for investors. Beyond simple price charts, various on-chain and fundamental indicators help gauge Bitcoin’s valuation, scarcity, and market sentiment.
This guide explores three key Bitcoin charts, the NVT Ratio, Stock-to-Flow Model, and Long-Term Hodler Behavior, that can potentially inform investment decisions and provide strategic entry points.
Bitcoin’s NVT Ratio
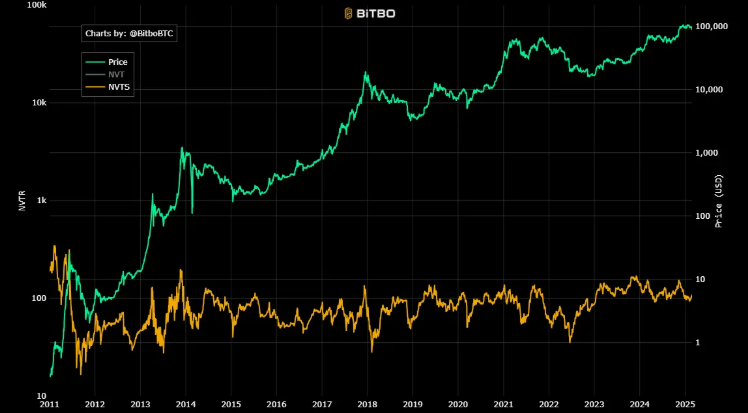
Chart by Bitbo
According to Samara Asset Group, Bitcoin’s Network Value to Transaction (NVT) ratio chart serves as a potentially insightful tool for making investment decisions because it helps to evaluate bitcoin’s valuation relative to its transaction activity.
Analogous to the Price-to-Earnings (P/E) ratio in traditional equity markets, the NVT ratio offers a quantitative approach to determine whether Bitcoin is overvalued, undervalued, or reasonably valued.
What The NVT Ratio Reveals
The NVT ratio measures Bitcoin’s valuation by comparing its market capitalization to daily transaction volume.
A high ratio suggests potential overvaluation (market cap exceeds transaction activity), while a low ratio indicates possible undervaluation (transaction volume is proportionally higher than market cap).
Stable NVT trends typically represent balanced, sustainable valuations. This metric serves as a useful tool for investors to assess Bitcoin’s relative value within their broader analysis framework.
Interpreting Trends for Investment Decisions
The NVT ratio serves as a key Bitcoin valuation indicator, helping investors interpret market conditions and make strategic decisions.
When the ratio is high, it suggests that Bitcoin may be overvalued compared to its transaction activity, potentially signaling investors to exercise caution with long positions or consider reducing exposure. Conversely, a low NVT ratio indicates possible undervaluation, as transaction utility exceeding market price historically correlates with price bottoms and subsequent uptrends, which may present buying opportunities.
During periods of sideways or stable NVT trends, the market demonstrates equilibrium, reflecting sustainable balance within an established phase, prompting investors to seek additional confirmation from other indicators rather than anticipating significant price movements.
Bitcoin’s Stock-to-Flow (S2F) Model
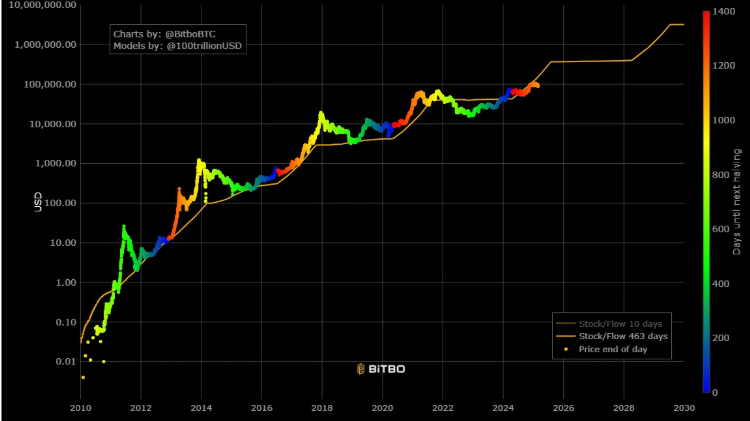
The S2F model quantifies Bitcoin’s scarcity by measuring the ratio between the existing supply (stock) and the rate of new production (flow).
This ratio increases systematically with each Bitcoin halving event, which occurs approximately every four years and reduces the new supply by 50%. As the S2F ratio increases, the model suggests that bitcoin’s value should appreciate accordingly.
Investment Applications
The model establishes a framework for price prediction based on bitcoin’s increasing scarcity. Historical data shows a correlation between higher S2F ratios and price appreciation, particularly following halving events. This correlation allows investors to formulate long-term investment strategies that align with bitcoin’s supply mechanics.
It also helps assess bitcoin’s fundamental value as a store of value asset. By comparing bitcoin’s scarcity metrics to those of traditional scarce commodities like gold, investors can better understand its position and evaluate its potential within a diversified portfolio.
Strategic Implementation
Investors often time their investments around halving events, accumulating bitcoin before these supply reductions occur in anticipation of subsequent price increases. The model can, therefore, provide strategic entry point guidance.
The S2F approach also promotes risk-managed decision-making by encouraging investors to focus on long-term fundamentals rather than short-term volatility. This perspective helps maintain investment conviction during market downturns.
Long-Term Holder (HODLer) Behavior
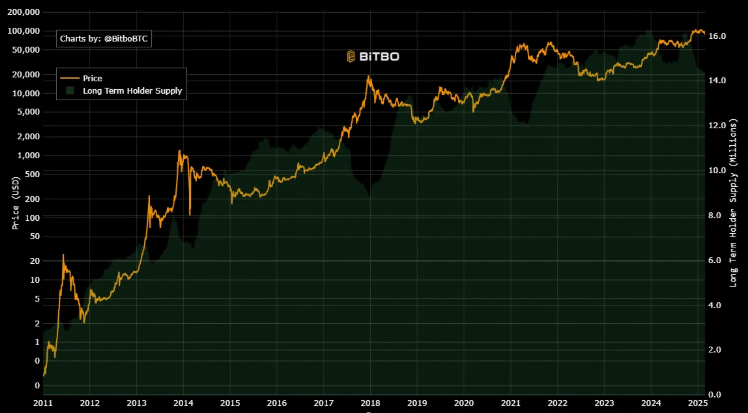
Chart by Bitbo
Long-Term Holder (HODLer) Behavior refers to the actions of long-term bitcoin holders who maintain their positions regardless of short-term market volatility.
Often referred to as ‘hodler’ the term “HODL” originated from a misspelling of “hold” in a 2013 forum post and has since become a central concept in bitcoin investment strategy.
HODLers are bitcoin investors who hold bitcoin for extended periods (typically more than 155 days), rarely sell during market fluctuations and contribute to what’s measured as “illiquid supply” that is bitcoin that rarely moves between wallets.
What HODLer Behavior Reveals
- Floor price indications: HODLers create natural price support levels as they accumulate and refuse to sell below certain thresholds.
- Market cycle position: The ratio between market value and long-term holder value (MVLV) helps identify where we are in market cycles with bear markets typically bottom when MVLV approaches 0 and bull markets tend to peak when MVLV exceeds 8.
- Supply liquidity: HODLers contribute to bitcoin’s scarcity by removing coins from active circulation, creating upward price pressure through reduced available supply.
- Conviction: The percentage of supply moving to illiquid entities reflects investor conviction and long-term outlook on bitcoin’s value proposition.
How HODLer Metrics Guide Investment Decisions
- Market-Value-to-Long-Term-Holder-Value (MVLV): This metric compares bitcoin’s current market value to the total value held by long-term investors. It helps identify potential market bottoms (when near 0) and overextended markets (when above 8).
- Market-Value-to-Illiquid-Value (MVIV): Similar to MVLV, this measures market value relative to bitcoin’s illiquid supply, providing insights on market overextension.
- Illiquid supply analysis: Tracking the percentage of bitcoin’s supply classified as illiquid helps investors understand broader accumulation trends and potential supply shocks.
- Exchange outflows: Movement of bitcoin from exchanges to self-custody or cold storage often indicates HODLer accumulation and can precede price increases.
HODLer metrics represent a significant evolution in bitcoin valuation models, shifting focus from purely technical indicators to fundamental on-chain data that reflects bitcoin’s core use case as a long-term store of value.
Final Thoughts
While no single chart or metric can guarantee investment success, combining multiple indicators can help form a well-rounded perspective on Bitcoin’s market trends.
By understanding and utilizing these metrics, investors can navigate Bitcoin’s price cycles with greater confidence and a degree of strategic foresight.
However, these indicators are most effective when analyzed in the context of broader market conditions. Ultimately, Bitcoin investment requires a mix of data-driven insights, patience, and risk management. By leveraging multiple analytical approaches, investors can enhance their understanding of market trends and make informed decisions in both bullish and bearish conditions.